Recent media reports talk about possibility of the Indian Rupee (INR) touching levels of 60 against USD. 57 is all time low level for INR and 60 is still 5% lower than the all time low levels. Is it really possible, and what are charts saying?
Lets take a quick look at USD/INR charts and figure out the short term and medium term trend, and whether the famous round number of 60 is just a elusive pipe dream for exporters!

Above is 6 months chart for USD/INR pair and one can note that after reaching a all-time high of 57, USD/INR pair is showing a behavior of lower highs and lower lows, this signifying a down-trend for USD against INR.
After the high of 57 in June,12, next highs for USD/INR pair was a range of 55-56 for about three months. After breaking this range downwards, USD touched a low of 52 recently in Oct, 12. Post Oct, 12 again a short term uptrend took USD/INR pair to 56 levels, however in recent weeks, the pair has traded down to 54 levels again.
What does that signify? That USD/INR pair is in downtrend from past 6 months, and there is infact technical probability of this pair breaking 52 and going further down.
Just to test our hypothesis, i will share a trick of looking at inverted charts, to double check the trend. Pls see the inverted chart for INR/USD pair below:
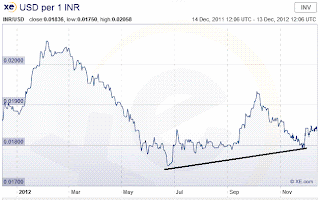
The inverted chart clearly shows a bottom getting formed at 0.17 levels in past 6 months, and hence the INR is strengthening at these levels. This clearly shows that technically speaking, probability of INR breaking 52 and getting stronger is much higher than INR getting weaker and reaching the so called 60 odd levels.
Thanks for reading this post and keep writing in to us.

No comments:
Post a Comment